Advanced Lua Debugging
I've had some more time to work with the Lua debugger in Leadwerks Game Engine 5 beta, and it's really amazing. Adding the engine classes into the debug information has been pretty simple. All it takes is a class function that adds members into a table and returns it to Lua.
	sol::table Texture::debug(sol::this_state ts) const
	{
		auto t = Object::debug(ts);
		t["size"] = size;
		t["format"] = format;
		t["type"] = type;
		t["flags"] = flags;
		t["samples"] = samples;
		t["faces"] = faces;
		return t;
	}
The base Object::debug function will add all the custom properties that you attach to the object:
	sol::table Object::debug(sol::this_state ts) const
	{
		sol::table t(ts, sol::create);
		for (auto& pair : entries)
		{
			if (pair.second.get_type() == sol::type::function) continue;
			if (Left(pair.first, 1) == "_") continue;
			t[pair.first] = pair.second;
		}
		return t;
	}
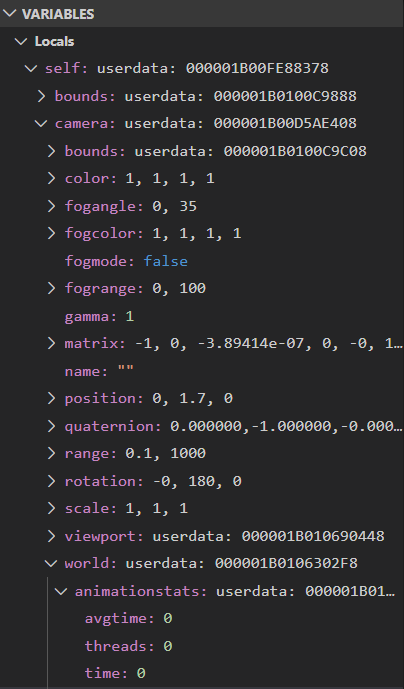
This allows you to access both the built-in class members and your own values you attach to an object. You can view all these variables in the side panel while debugging, in alphabetical order:

You can even hover over a variable to see its contents!

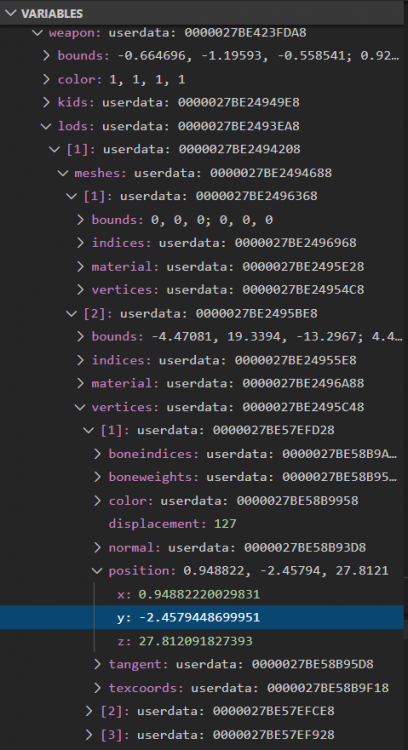
The Lua debugger in Leadwerks 4 just sends a static stack of data to the IDE that is a few levels deep, but the new Lua debugger in VS Code will actually allow you to traverse the code and look all around your program. You can drill down as deep as you want, even viewing the positions of individual vertices in a model:
This gives us a degree of power we've never had before with Lua game coding. Programming games with Lua will be easier than ever in our new game engine, and it's easy to add your own C++ classes to the environment.
-
 3
3


1 Comment
Recommended Comments